tale of the dolly varden and the slimy sculpin

I’ve been thinking about deep solutions. The E. O. Wilson Biodiversity Foundation has some. I spotted a recent update on their Instagram that got my attention—the post pointed to a Half-Earth Project StoryMap, “Priority Places for Biodiversity Conservation,” developed with Yale’s Map of Life, to explore how high-resolution data on species richness and rarity can help inform conservation decisions about the establishment of protected areas.
I was first introduced to ESRI’s StoryMaps in a Half-Earth Project Educator Ambassador Institute at the Half-Earth Day event at UC Berkeley in 2019. (You can create a free StoryMaps account and make your own StoryMaps and/or you can explore some of the many StoryMaps people have created.)
Clicking into this Half-Earth StoryMap, you’ll learn about the Species Protection Index (SPI):
The Half-Earth Project Map and the Map of Life analyze protected area data to calculate the Species Protection Index (SPI), a biodiversity indicator that assesses not just how much area is protected, but if those areas actually conserve species habitats.
The Half-Earth StoryMap gives you an overview of the many layers of data on the Half-Earth Project Map. In the StoryMap, explore the species richness map and the species rarity map (drag the sliders) and investigate biodiversity hotspots. Once you’ve scrolled and interacted with the StoryMap, you’ll be ready to dive into the Half-Earth Project Map. On the opening screen, you’ll be able to select an audio tour to learn more about priority areas or national report cards on conservation efforts. I recommend the audio tours. There’s a lot going on in this map and it’s helpful to have the audio overview as an intro.
The Half-Earth Project Map and the Map of Life are powerful tools to visit again and again (best experienced on a laptop or desktop computer). Explore it with friends, family, students.
From the MDL Archives
Rabbit tracks. Deer tracks. What do we know. Notes on the 2019 Half-Earth Day event at UC Berkeley.
Make common cause with young people. Notes on E. O. Wilson’s book, Half-Earth, with an excerpt.
Elsewhere on the Wild Wild Web
Alaskan rivers turning orange due to climate change, study finds. By Aliya Uteuova. The Guardian, 5.22.24
EXCERPT:
“When mixed with another river, it can actually make the metals even more potent [in its] impact to aquatic health,” Poulin said.
The phenomenon was first observed in 2018, when researchers noticed the milky orange appearance of the rivers across northern Alaska’s Brooks Range, a stark contrast to the crystal clear waters seen the year prior.
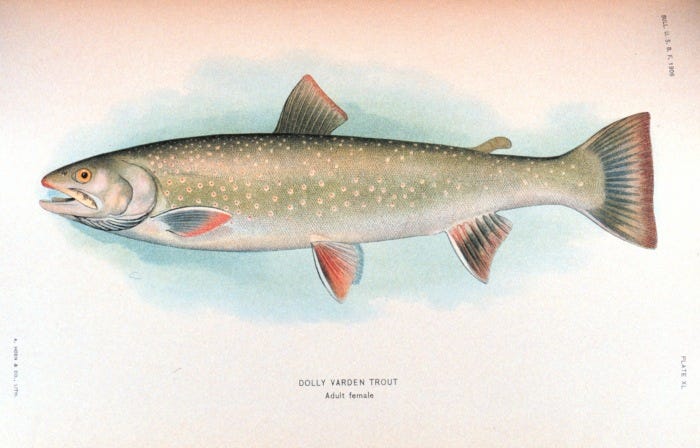
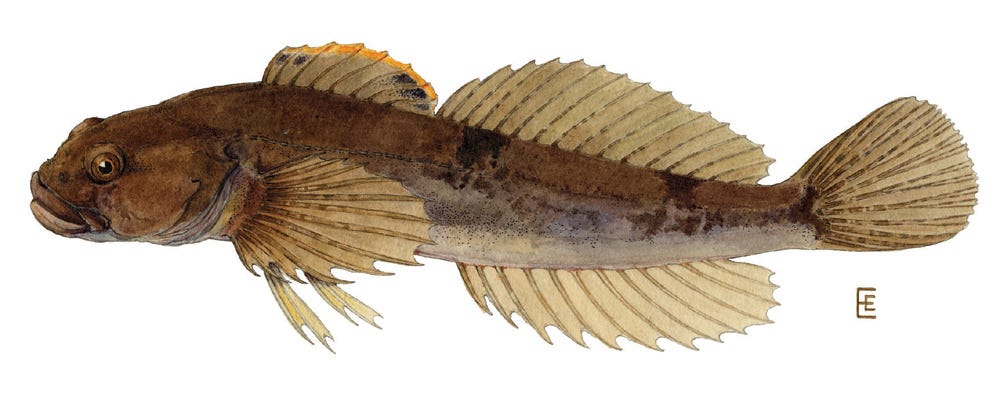
Within the year, a tributary of the Akillik river in Kobuk Valley national park saw the complete loss of two local fish species: the dolly varden and the slimy sculpin.
“Our data suggests that when the river turned orange, we saw a significant decrease in macroinvertebrates and biofilm on the bottom of the stream, which is essentially the base of the food web,” Poulin said of the rusting phenomenon. “It could be changing where fish are going to be able to live.”

Be well. A warm welcome to the new subscribers. Thank you for making time to read The Interconnect. I’m glad you’ve found your way here and I hope you stay a while. And please consider sharing this post with family, friends, teachers, and/or colleagues who might appreciate it and put it to work.


